Perceptual Contrast Difference vs. Stacked JND's For Determining Video Quality
The following illustrates how stacked JND's are not a good measure for quantifying how much of a difference people see between two images. A much more direct and accurate measure is the perceptual contrast difference.
Perceptual contrast and JND are related as follows: 1 JND corresponds to threshold perceptual contrast of approximately 0.1% [1]. Both JND and perceptual contrast above threshold are a function objective Michaelson's contrast and many parameters such as spatial frequency, temporal frequency, average luminance, "pedestal contrast" (explained below), total area, and other aspects of the video difference (such as an impairment) detected. To understand how perceptual sensitivity to these parameters change from threshold (1 JND, ~0.1% perceptual contrast) to suprathreshold (>> 0.1% perceptual contrast) is to understand why stacked JND's do not accurately quantify perceptual differences in general.
Perceptual Contrast Vs. Image Parameters
We first examine some of the parameters that determine perceptual contrast. We will see how perceptual contrast varies with these parameters differently when perceptual differences are close to 1 JND (perceptual threshold) vs. when differences are significantly above threshold (supra-threshold).
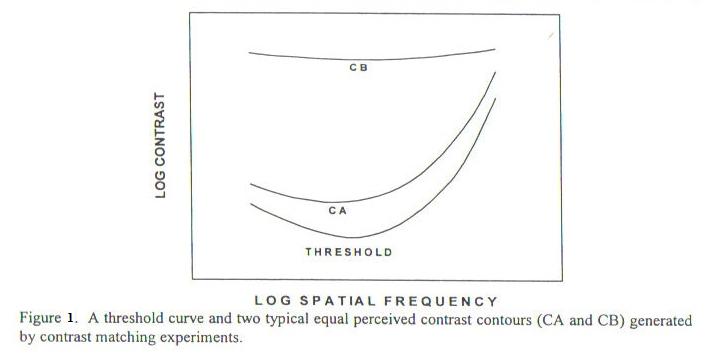
Perceptual Contrast Vs. Spatial Frequency
Let's start with examining how perceptual contrast varies with spatial frequency. Figure 1 (from Fig 2 of [1]) shows how the further from threshold contrast is, the flatter the perceptual response is across spatial frequency. We will revisit this difference when we examine how each increment for stacked JND's vary with spatial frequency as shown in Figure 4.
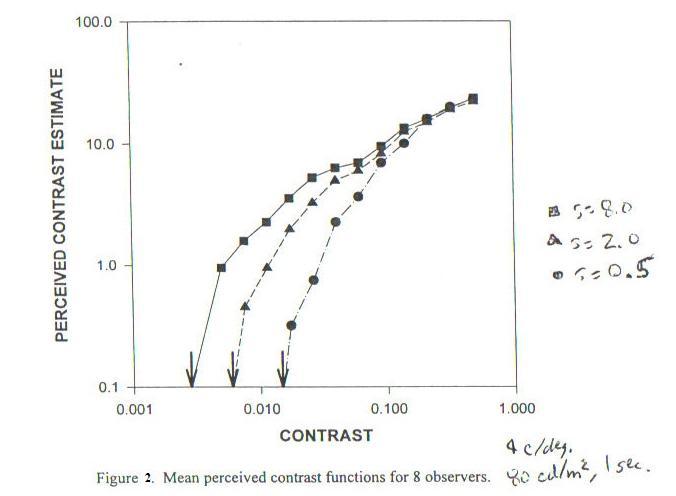
Perceptual Contrast (From 1 JND And Up) Vs. Contrast Level And Area
Figure 2 (from Figure 4 of [1]) shows this relationship. In addition to the relationship shown in Figure 1, Figure 2 also shows how threshold is quite dependent on the size (area in square cycles per degree) of the difference seen, while supra-threshold sensitivity is not once contrast is sufficiently higher than threshold.
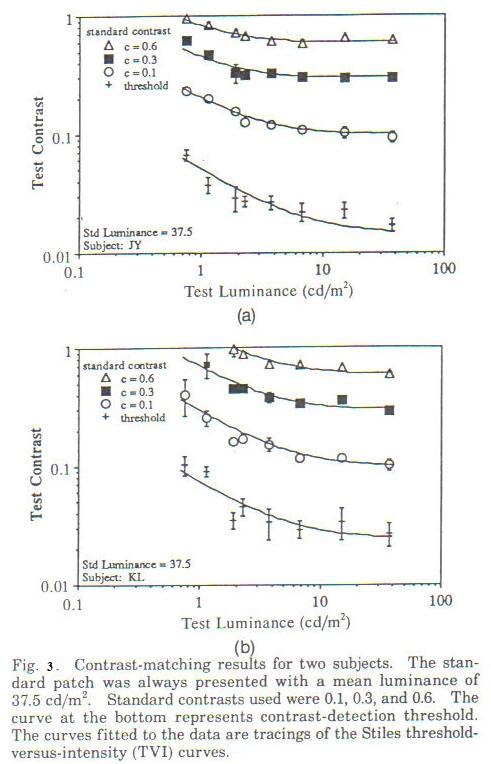
Perceptual Contrast (From 1 JND And Up) Vs. Luminance
Figure 3 (from Figure 2 of [2]) shows this relationship. Note how theshold contrast stimulus changes with luminance more than supra-threshold contrast stimulus does in order to maintain respective perceptual contast.
Stacked JND's
The idea behind using stacked JND's (just noticable differences) is that successive JND differences using scaled versions of a superimposed impairment can be quatified as the number of successions times 1 JND:
For the first JND difference, a given impairment I is supperimposed with weight w0 on a picture P0 to produce a second picture P1 such that the perceptual difference between P0 and P1 = P0+I*w0 is 1 JND. For successive "stacked" JND's, a third picture P3, with one additional JND difference (2 JND's) from the first picture P0, may be created with the appropriate weight such that the difference between P1 and P2 = P1+I*w1 is also 1 JND. This can be continued until the limits of actual or perceptual contrast are reached:
   JND's from P0:        Successive JND

        1                P1 = P0+I*w0
   	2                P2 = P1+I*w1
   	3                P3 = P2+I*w2
   	4                P4 = P3+I*w3
        ....
        n                P[n] = P[n-1]+I*w[n-1]
The weights required depend on both P0 and I, including the local contrast, spatial frequencies and mean luminance of each. The relationship between the contrast of P[n-1] and the weight w[n-1] required for 1 JND is known as the dipper function, for example: with the first w values successively decreasing until reaching a minimum, and thereafter increasing. Mean luminance levels also effect the weights, approximately following Weber's Law, except at extreme low or high values of luminance or other parameters (including contrast, spatial and temporal frequencies). Perceptual contrast sensitivity depends on all of these parameters as well. However, it is instructive to compare how different the weights are when comparing stacked JND's to supra-threshold perceptual contrast.
Stacked JND: How Weights Depend On Spatial Frequency
Weights w are largest for highest frequencies and lowest for mid-frequencies. Thus, for exmaple, a 6 JND difference (between P6 and P0) for a mid-frequency (say 4 cycles per degree of visual field) will generally have a much smaller sum of weights (Wsum = sum w[n], n=0 to 5) than the Wsum' = sum of weights w'[n] for a 6 JND difference for a high spatial frequency (for example 16 cycles per degree, images P6' and P0')
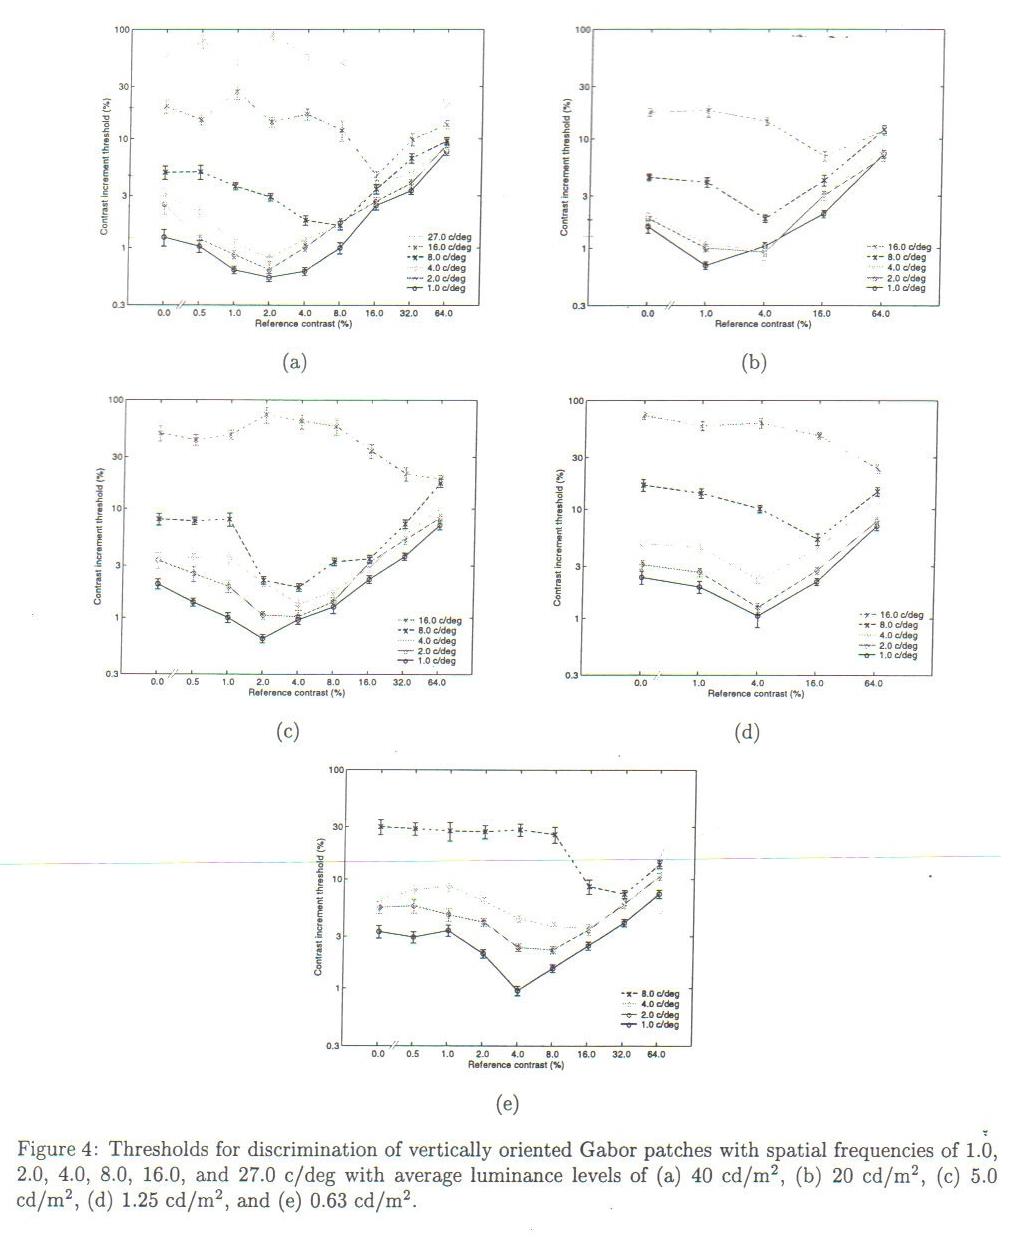
Figure 4 shows 5 example graphs of the dependence of JND on contrast level and spatial frequency. Each of the 5 plots is at a different mean luminance level.
Comparing Perceptual Contrast And Stacked JND's Both Vs. Spatial Frequency
If we now look at the weights required to maintain a given contrast across spatial frequency, we see they are quite different from the stacked JND weights. For example, suppose we find a weight wpc' such that the perceptual contrast of the high frequency image P6pc'= P0' + I*wpc' has the same percpetual contrast as P6 (the mid frequency stacked JND image). It may be suprising that generally wpc' < Wsum < Wsum'. If stacked JND's were a good predictor of how different things appear, then one would expect that wpc' would be approximately equal to wsum'.
This can be seen, for example, compare Figure 1 Threshold Curve with Suprathreshold Curves (CA and CB). Then note how all threshold increments for 16cpd are larger than 4cpd for each plot in Figure 4, so the sum of increments for 16cpd must be greater than the sum of increments for 4cpd.
Understanding This Apparent Discrepancy
First, note that in determining JND's, there is a threshold effect below which no subjective quantification can be performed and above which it can be performed. This threshold effect has been described and accurately modelled in vision science as a signal being detected in the presence of noise. Starting with P[n-1], it takes an increment of I*w[n-1] ~= noise before the signal is detected. An increment below this threshold cannot be quantified well, but the further above the threshold it can with increasing accuracy.
So, for each JND, there is a quantum jump across this threshold to reach the next level. If the threshold mechanism
(noise in our analogy) is constant over spatial frequency, luminance level, local contrast, etc., then stacked JND's could be used as a good estimate of percieved differences. However, this is not what vision science experiments have shown.
Conclusion
In conclusion, since stacked JND differences across parameter space are significantly different from supra-threshold perceptual contrast across the same parameter space, stacked JND's are not a good metric for quantifying perceptual differences, and therefore, problematic in the use for predicting suprathreshold type video qaulity ratings such as DMOS.
References
- 1. M. Cannon, “A Multiple Spatial Filter Model for Suprathreshold Contrast Perception,” in Vision Models for Target Detection and Recognition, ed. Eli Peli ( World Scientific Publishing, River Edge, NJ, 1995), pp. 88-117.
- 2. Eli Peli, Jian Yang, Robert Goldstein, Adam Reeves, “Effect of luminance on suprathreshold contrast perception,” J. Opt. Soc. Am., August 1991, Vol. 8, No. 8, pp. 1352-1359.
- 3. Taylor, Pizlo, Allebach, “Contrast Detection and Discrimination Thresholds for Visual Models,”
Except for graphs,
Copyright © 2008
Kevin Ferguson/debone.com All Rights Reserved.Any redistribution of information found at this site is prohibited.